Family Income and Expenditures - Agriculture
Agricultural Land
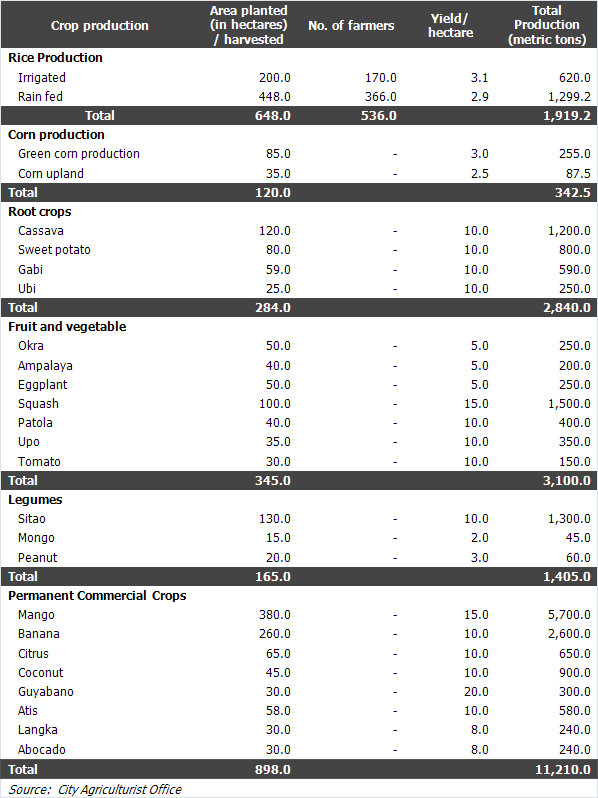
As of 2000, the agricultural land of the City devoted to crop production total 2,460 hectares. This is approximately eight percent of the total city area. Moreover, it represents only about 35 percent of the 7,000 hectares of land assessed by the Bureau of Soil and Water Management as lands suitable for crop production based on soil fertility and topography. Majority or 36.5 percent of the current productive lands is devoted to permanent commercial crops while about 26 percent is devoted to rice production.
|
Table 5.6 Crop Production, 2000
|
|
 |
|
Rice
About 648 hectares of the City's land is devoted to rice production. Only about 31 percent or 200 hectares of these are irrigated. These irrigated lands are mostly located in barangays Dulong Bayan, Kaypian, Sto. Cristo, Minuyan, and Kaybanban. Total annual production for rice is estimated to be 1,919.2 metric tons based on yield estimate of 3.1 MT/hectare for irrigated lands and 2.9 MT/hectare for rainfed lands.
|
Corn
Latest corn production data reached a total of 342.5 MT. The total planted area was 120 hectares. Most of these are devoted to green corn production which has an average yield of 3 MT/ hectare. Corn planted in the upland produced lower yields at 2.5 MT/ hectare.
|
Fruits and Vegetables
About 350 hectares of land is devoted to fruits and vegetables production. The vegetable crops planted in the city are Okra, Ampalaya, Eggplant, Squash, Patola, Upo and Tomato. Among these, squash, which is panted in about 100 hectares of land, produced the most yields at 1,500 MT per annum.
|
Legumes
Legumes planted in the city are Sitao, Mungo and Peanut. They occupied 165 hectares of land and produced a combined annual yield of 1,405 MT.
|
Permanent Commercial Crops
Permanent commercial crops were planted in some 898 hectares of land. These include mango, banana, citrus, coconut, guyabano, atis, and langka. Mango has the largest share in terms of land area with 380 hectares and the total produce which is 5,700 kilos.
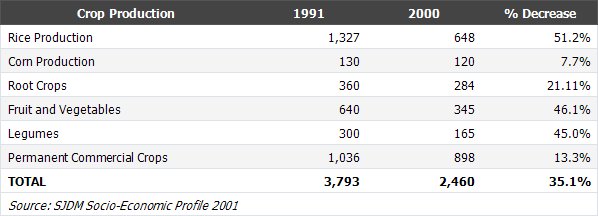
A significant decrease (35.7%) in the areas devoted for crop production was observed in the last ten years. Non-permanent crops such as rice, fruits and vegetables and legumes suffered the most decrease. In rice production for instance, the area more than halved in the period 1991 to 2001.
|
Table 5.7 Comparative Areas for Crop Production, 1991 and 2000
|
|
 |
|
Agricultural Facilities
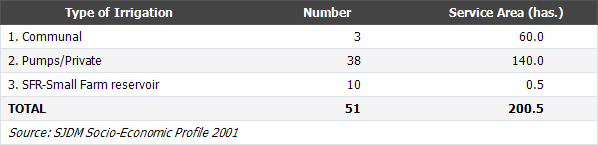
Only about 200 hectares of the City's lands are serviced by irrigation systems. Among the systems used for irrigations are communal, pumps, and small farm reservoir. Private pumps irrigate 70 percent or 140 hectares of the land. Table 5.8 below shows the distribution and service area of these irrigation systems.
|
Table 5.8 Irrigation Systems
|
|
 |
|
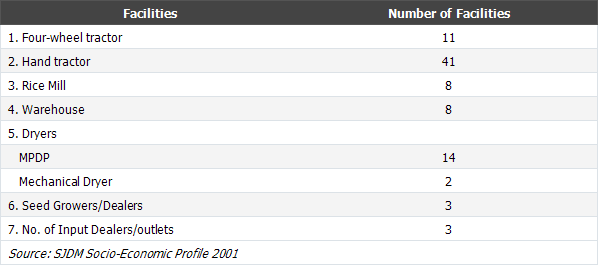
Post harvest facilities are critical to the process of agricultural production. A number of facilities and equipment are available for the farmers of the City. For instance, there are eight rice mills located within the City.
|
Table 5.9 Post Harvest Facilities
|
|
 |
|
Livestock and Poultry
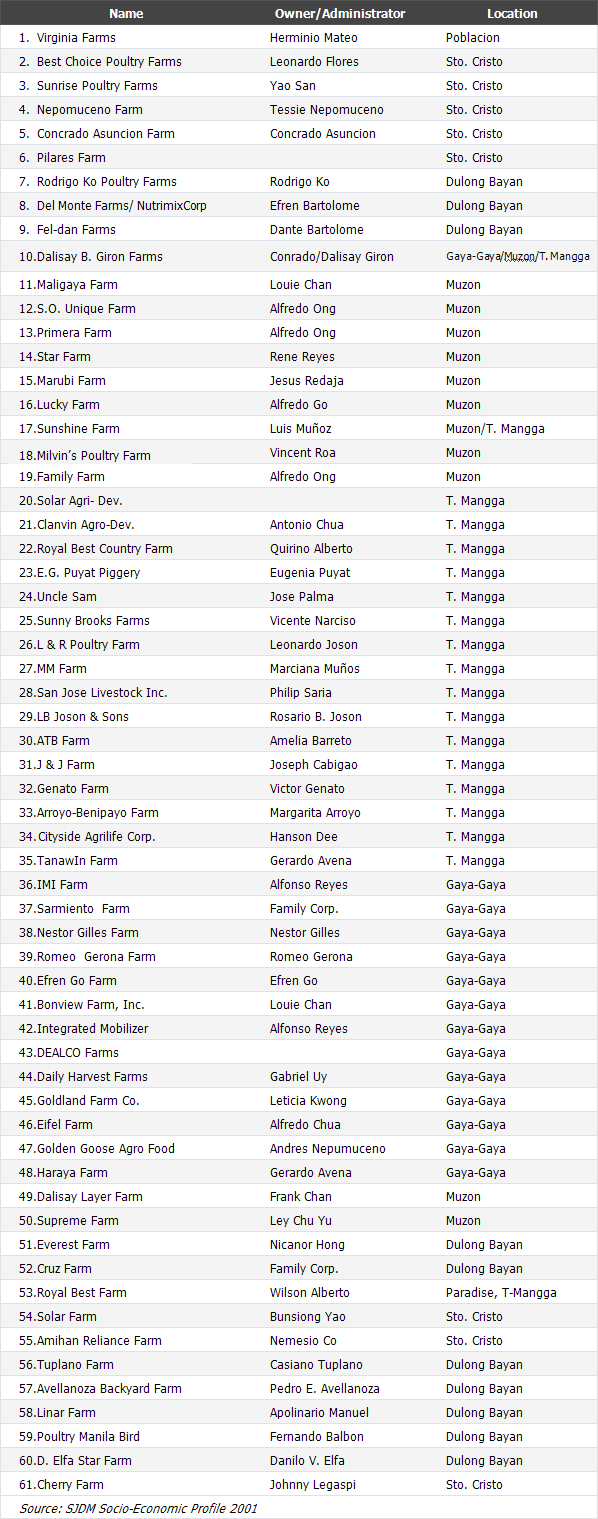
Livestock and poultry remain to be the dominant industry of the City. Latest data show that there are some 61 commercial livestock and poultry farms in the City. These are mostly located in barangays Poblacion, Sto. Cristo, Dulong Bayan, Gaya-gaya, Muzon, and Tungkong Mangga.
|
Table 5.10 List of Commercial Livestock and Poultry Farms
|
|
 |
|